Indigenous knowledge key to mapping dugong populations
The dugong aerial survey, undertaken in partnership with the Balanggarra, Wunambal Gaambera,Dambimangari and Bardi Jawi ranger groups, was completed in October 2015.
Research leader for WAMSI’s dugong management project in the Kimberley, CSIRO’s Dr Peter Bayliss, released initial results ahead of a satellite and acoustic tagging field trip later this year.
“Our initial estimate is that there are about 12,000 dugongs (plus or minus a 12% error) in the North Kimberley, a density of 0.36 per km2 over about 33,000 km2 of coastal waters surveyed (Table 1),” Dr Bayliss reported. “The density estimate is similar to those found for other regions of northern Australia that also have large areas of seagrass habitat in clear shallow (< 20 m) coastal waters. Whilst we use the most updated scientific corrections for the proportion of dugongs under the water and missed by observers during surveys, it is important to understand that our estimates of abundance should still be treated as “minimum” estimates. The only way to reliably estimate absolute or true numbers would be to use recently developed close-kin genetic methods, developed by CSIRO for Southern Bluefin Tuna and applied to many other difficult to observe marine species”.
Table 1. Estimates of population size (N̂ + SE) and density (D̂ + SE km-2) of dugongs in the North Kimberley (Sept. – Oct. 2015) using updated methods to correct counts for the number of animals missed during the survey. SE and %SE are the Standard Error and percentage SE, respectively.
|
Block |
N̂ |
SE |
% SE |
D̂ |
SE |
|
3 |
1,758 |
452 |
25.7 |
0.22 |
0.06 |
|
4 |
2,119 |
444 |
21.0 |
0.28 |
0.06 |
|
5 |
2,926 |
792 |
27.1 |
0.55 |
0.15 |
|
6 |
3,682 |
929 |
25.2 |
0.69 |
0.17 |
|
7 |
636 |
170 |
26.7 |
0.31 |
0.08 |
|
8 |
541 |
112 |
20.7 |
0.26 |
0.05 |
|
9 |
177 |
43 |
24.0 |
0.07 |
0.02 |
|
Total |
11,839 |
(+ 1,391) |
11.8 |
0.36 |
(+ 0.04) |
A method was trialled to integrate Indigenous Ecological Knowledge with scientific survey data to help identify important dugong areas. Three sources of knowledge were used: (i) Indigenous Ecological Knowledge (location of important dugong areas mapped in Healthy Country Plans); (ii) the seagrass map developed from satellite images; and (iii) the dry season abundance estimates from the aerial survey in September-October 2015.
“The method gives strong weighting to Indigenous Knowledge as it represents knowledge accumulated over millennium time periods compared to the “snapshots” of scientific observational data taken over very short time frames,” Dr Bayliss said.
Abundance “hotspots”
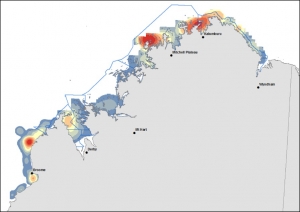
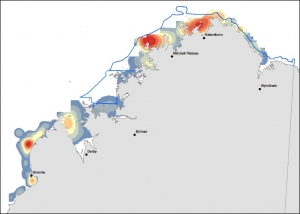
The distribution and abundance maps of dugongs and other marine wildlife species (e.g. large turtles, dolphins) are illustrated twice in the team’s 2016 annual report, with one map showing the Native Title sea country boundaries and the other the Department of Parks and Wildlife WA marine reserve boundaries (i.e. the existing Camden Sound-Lalang-garram marine park & the proposed Horizontal Falls & North Kimberley marine parks), and comprise a valuable planning resource to on-ground managers.
Figure 1 (a & b) identifies dugong abundance “hotspots” using aerial survey data extrapolated and smoothed in a GIS over a fine spatial scale. Red colours represent high density, blue colours low density areas with an intermediate colour scale between these two extremes (orange, yellow & grey colours).
|
|
Proportion of calves
Calves were identified by their small size and close proximity to another, larger animal. About 6% (21/350) of all dugongs seen were reported as calves and these sightings were spread evenly throughout the Kimberley coastal waters. The proportion is about mid-way between those reported elsewhere across northern Australia (3-14% for the Northern Territory & 14% for the Torres Strait) and likely reflects regional and seasonal differences.
Indigenous Ecological Knowledge
The WAMSI Dugong research project combines Indigenous and scientific knowledge through partnership and full participation of Balanggarra, Wunambal Gaambera, Dambimangari and Bardi Jawi ranger groups.
“The partnership approach has been successful in developing the first baseline in the Kimberley for the distribution and abundance of dugongs using standardised aerial survey methods, and most of that success was due to an intensive pre-survey training course run jointly with the ranger groups at Gambimerri ranger station on Wunambal Gaambera Country. The movement study commencing in August using satellite and acoustic tagging technologies will adopt the same partnership approach to combine our different skills and to share knowledge” Dr Bayliss said.
“We have also trialled a focussed two-day interview process with Dambimangari elders and senior Traditional Owners who have cultural knowledge of dugongs,” Dr Bayliss said. “The interviews were successful in providing important insights into the cultural value of dugongs and additional information on important dugong areas. We hope to extend these focussed interviews to other Kimberley groups willing to share their dugong stories.”
The Indigenous partnership work developed on the WAMSI Dugong project will be developed further through WAMSI’s Indigenous Knowledge project.
The $30 million Kimberley Marine Research Program is funded through major investment supported by $12 million from the Western Australian government’s Kimberley Science and Conservation Strategy co-invested by the WAMSI partners and supported by the Traditional Owners of the Kimberley.


