Particles and the UVP – One Ten East log

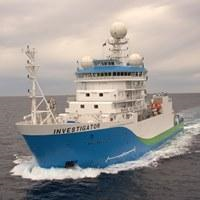
One Ten East Logs from the IIOE-2 voyage aboard RV Investigator will be posted on the WAMSI website during the month long voyage.

We have had some gorgeous distinctively tropical birds recently, a juvenile red-tailed tropicbird and two Golden Bosun birds!
– Captain Micheline Jenner 

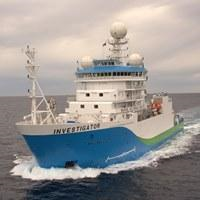
The RV Investigator is currently undertaking oceanographic research along the 110°E meridian off Western Australia as part of the second International Indian Ocean Expedition. The voyage is led by Professor Lynnath Beckley of Murdoch University and the research is supported by a grant of sea time on RV Investigator from the CSIRO Marine National Facility.

Date: June 05, 2019 Time:  1200 AWST
Latitude: 11.5°S Longitude: 110°E
Wind direction: ENE Wind speed: 9 knots
Swell direction: SE 2 m Depth: 4527 m
Air temperature: 27°C Sea temperature: 28°C

Notes: Last station on the line! We made it! The RV Investigator has followed in the wake of the HMAS Diamantina.

Particles and the UVP

By David Antoine

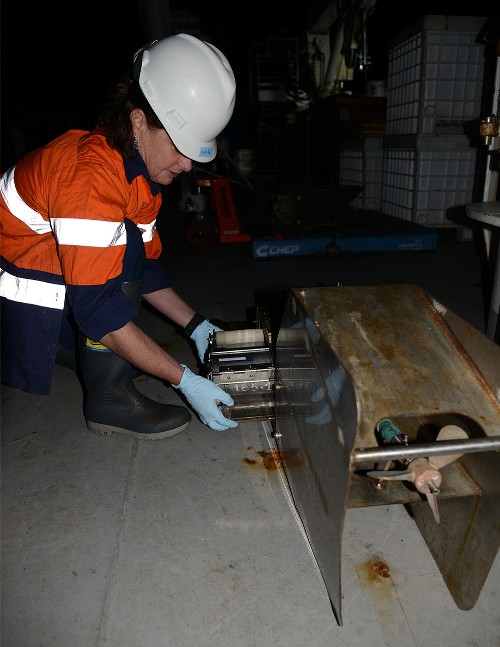
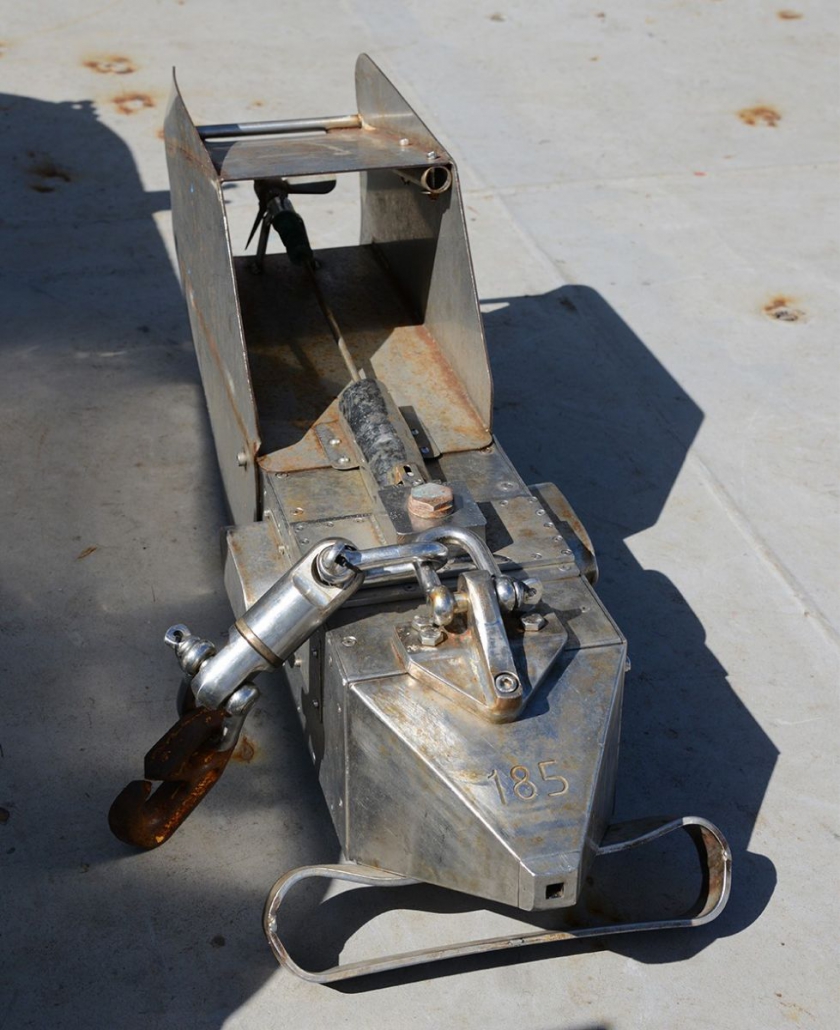
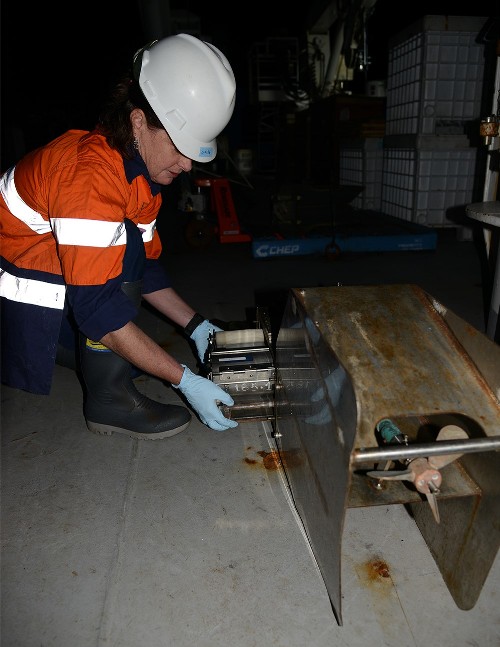
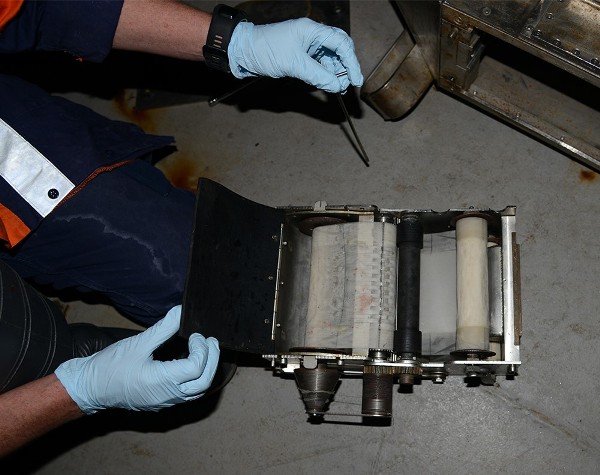
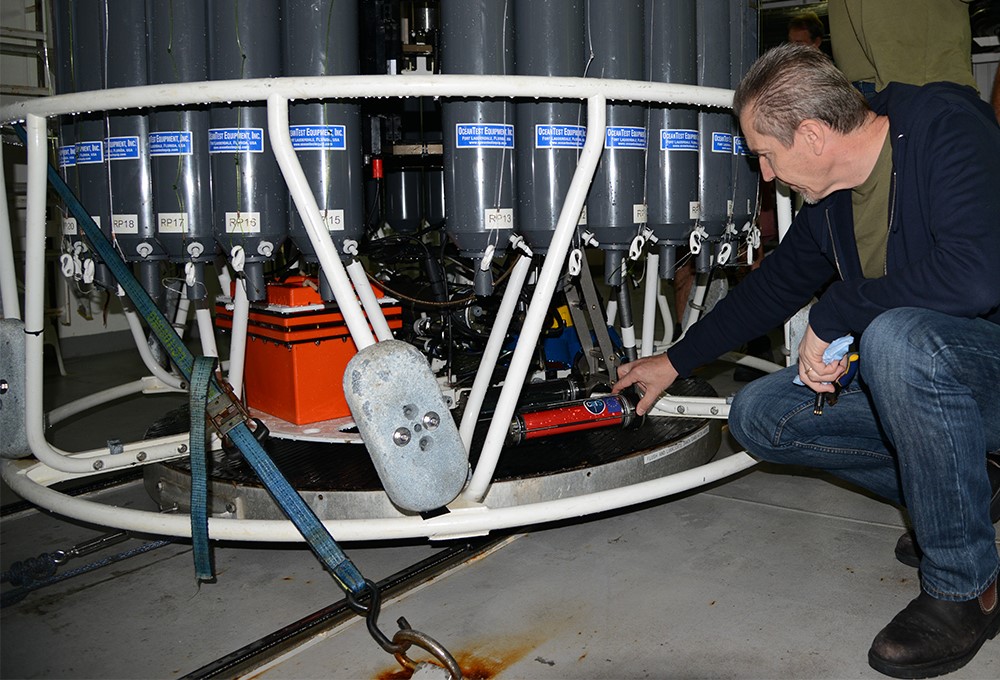
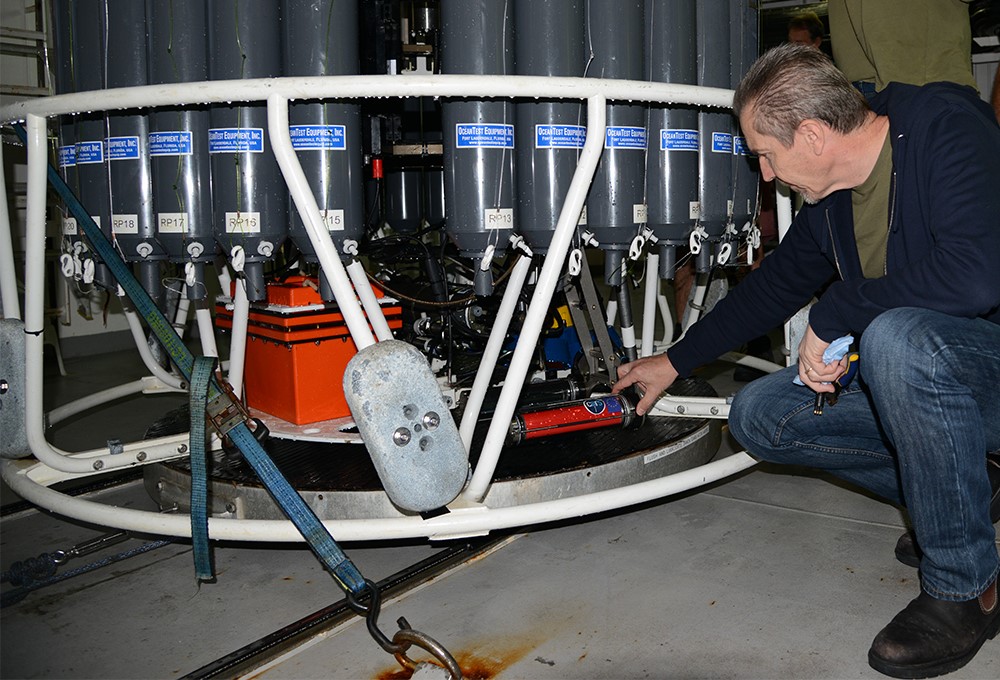
A key descriptor of marine ecosystems is a particle size distribution, which is expressed as the number of particles or volume of particles in the water column. The particle size distribution is one of the parameters that determines bulk optical properties of a water mass. Various techniques exist to determine the particle size distribution and for large particles greater than100 microns, we are using the “Under Water Video Profiler” (UVP) on board the RV Investigator.

This instrument captures images of the particles so that one can identify what is present. The technique also allows derivation of the export flux of particles to the deep ocean.

In the CTD room, Prof David Antoine (Curtin University) checks the UVP (two red cylinders) at the base of the CTD. Photo: Micheline Jenner AM.


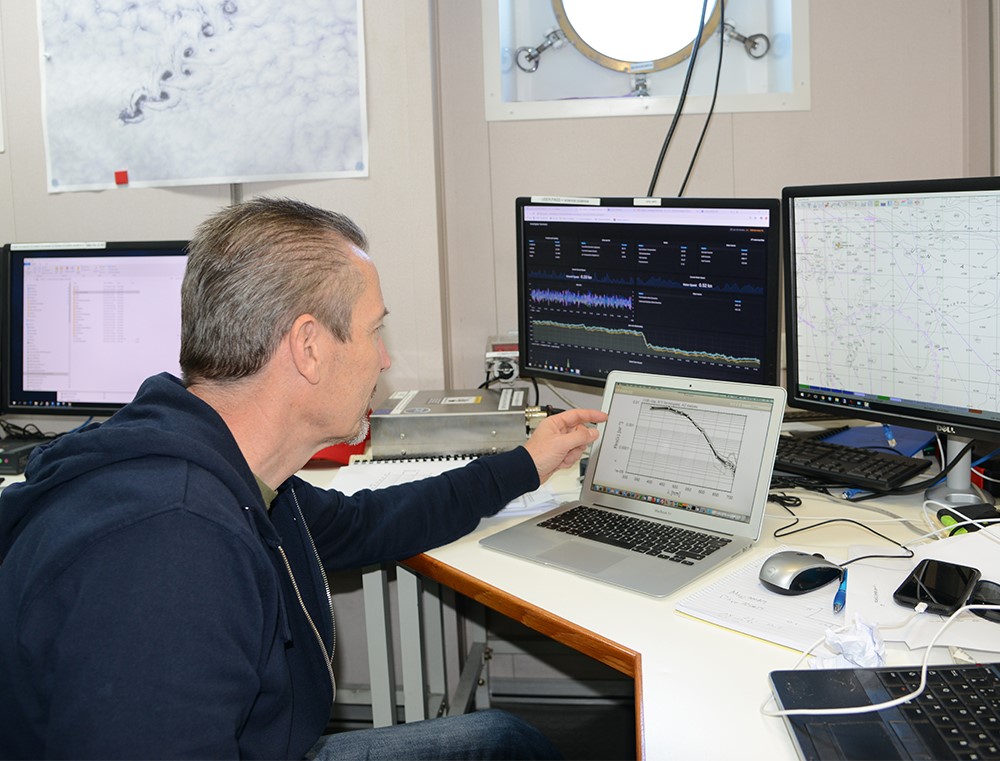
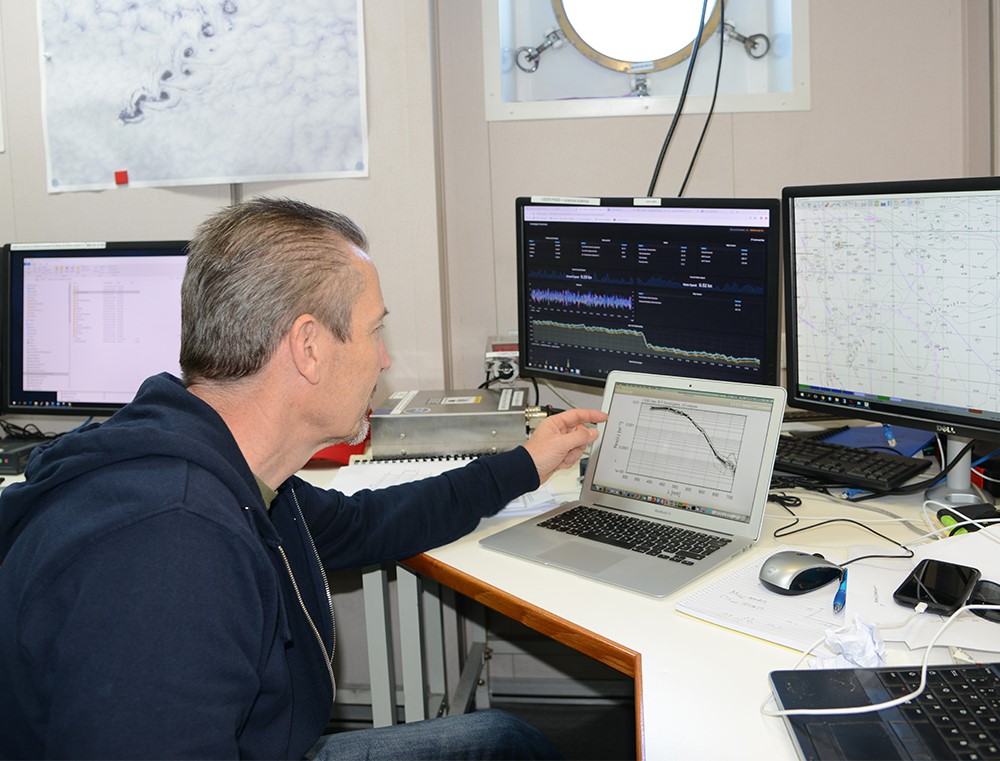
Prof David Antoine (Curtin University) processes data from the UVP. Photo: Micheline Jenner AM.

Blue on Blue – One Ten East log

One Ten East Logs from the IIOE-2 voyage aboard RV Investigator will be posted on the WAMSI website during the month long voyage.

We have had more beautiful deep blue water and amazing cumulus clouds today. The clouds literally forming vertically before our eyes, just gorgeous!
– Captain Micheline Jenner 

Log from One Ten East

The RV Investigator is currently undertaking oceanographic research along the 110°E meridian off Western Australia as part of the second International Indian Ocean Expedition. The voyage is led by Professor Lynnath Beckley of Murdoch University and the research is supported by a grant of sea time on RV Investigator from the CSIRO Marine National Facility.

Date: June 04, 2019 Time:  1200 AWST
Latitude: 12.5°S Longitude: 110°E
Wind direction: E Wind speed: 12 knots
Swell direction: SE 2m Depth: 4738 m
Air temperature: 27°C Sea temperature: 28°C

Notes: We have seen a white-tailed tropicbird, a frigate and two golden bosun birds! We are really in the tropics!

Blue on Blue

By Micheline Jenner AM and Curt Jenner AM

Despite their huge size, blue whales are remarkably elusive. Criss-crossing the world’s oceans as part of their life cycle, these days, they are hard to find. Being so large–in fact, the largest animals on earth, blue whales were once the most desired target species for 19th and 20th century whalers. The effort outlaid to chase and capture a whale, known as the catch-per-unit effort was categorized by the whalers as a “1” for a blue whale. The smaller humpback whale was classed as a “4”, indicating that it took four humpback whales to provide the same amount of oil as one prized blue. Alarmingly, in their efforts to provide for lighting of motherland lamps, produce lipstick, wear fine corsets, consume margarine and shade with umbrellas, whalers killed 202,000 to 311,000 Antarctic blue whales and 13,000 pygmy blue whales.

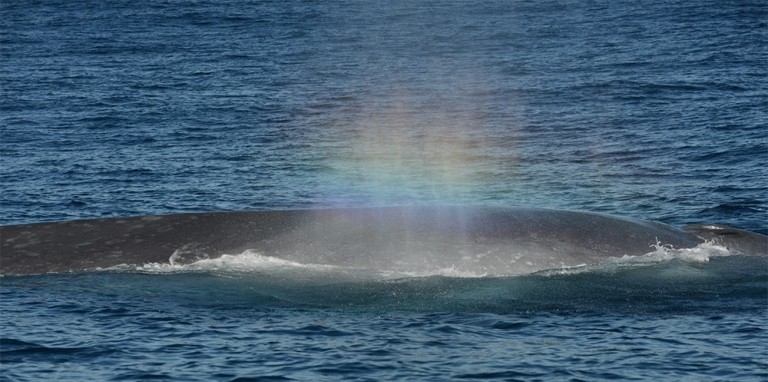
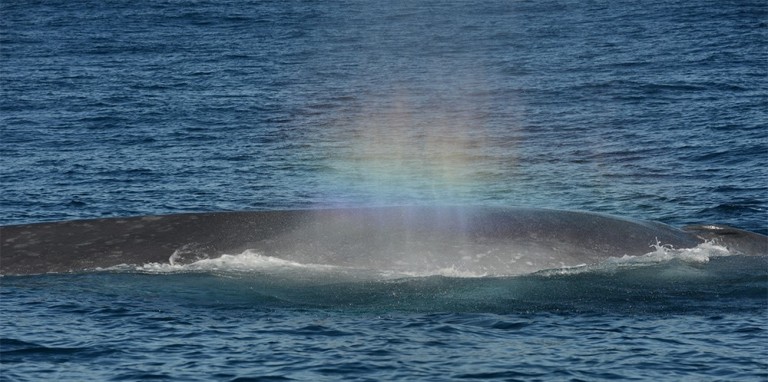
The first blow as a pygmy blue whale surfaces can be up to 9m high. Subsequent exhalations throughout a surfacing sequence, sometimes diffuse in light winds causing a “rainblow” effect. Photo: Micheline Jenner AM.

Now in the 21st century, cetacean scientists are still trying to determine how many blue whales are left in the world’s oceans. The IUCN recognises a global estimate of between 10-25,000 blue whales. Just what proportion of that estimate consists of Antarctic blue whales or pygmy blue whales, is anyone’s guess.

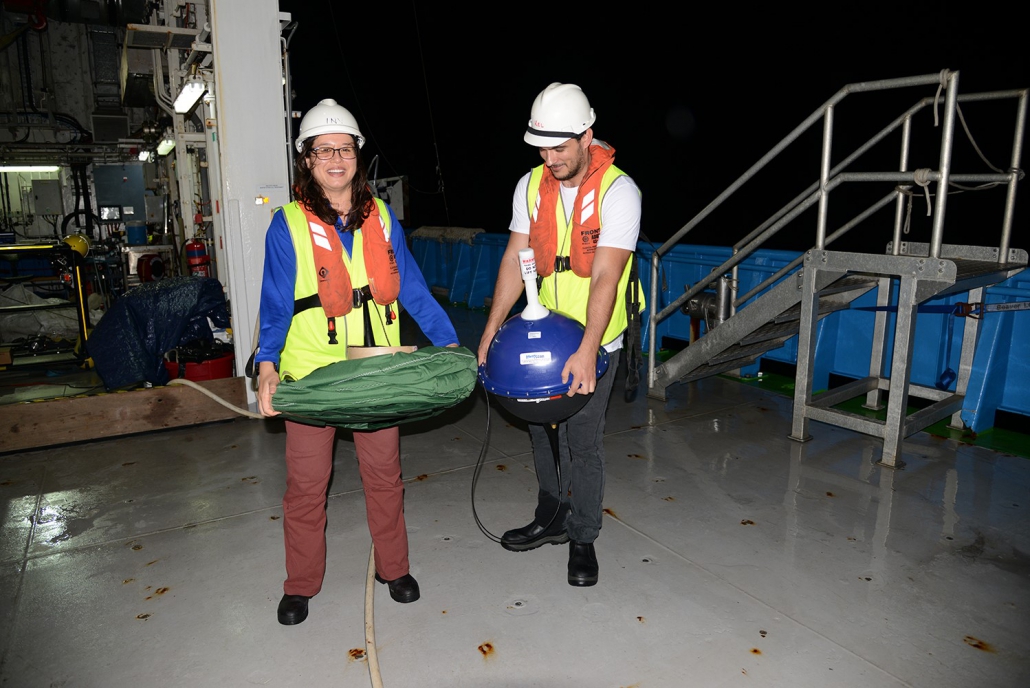
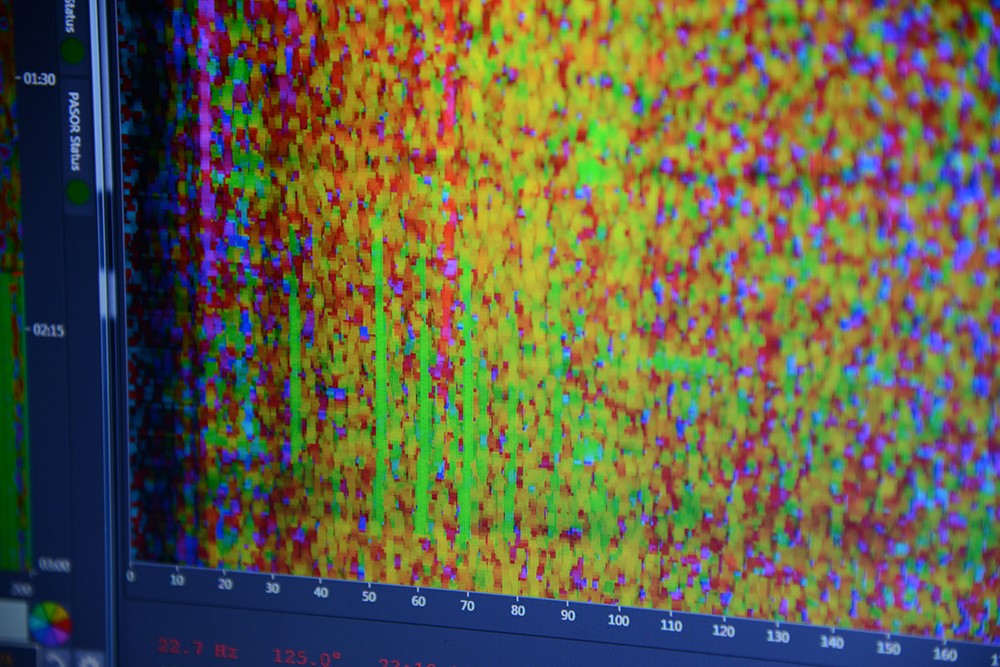
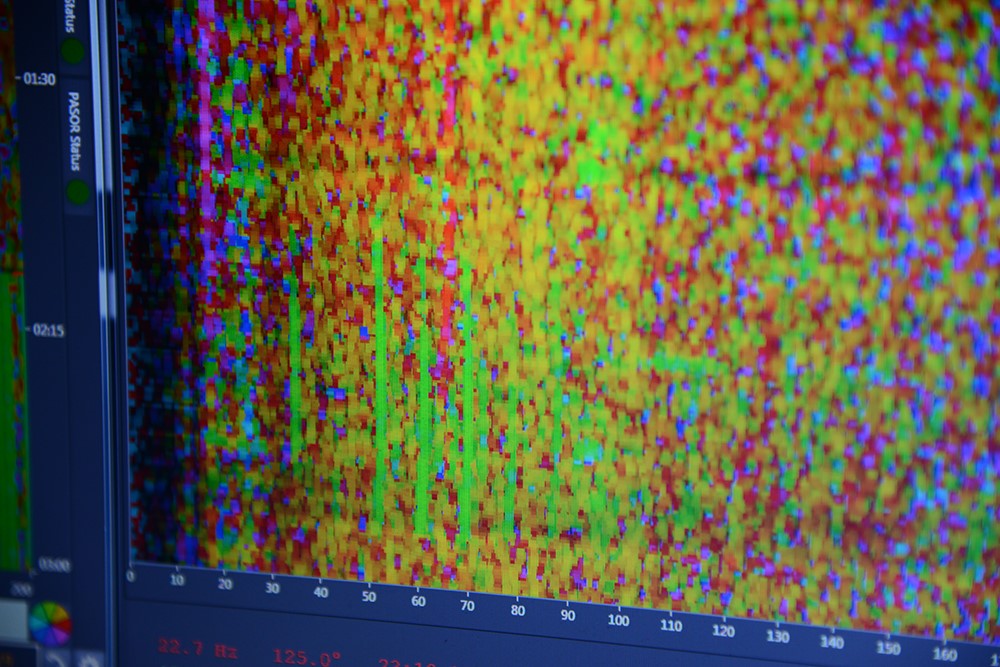
By listening to the sea with sonobuoys from RV Investigator, we are documenting the migration of pygmy blue whales while they migrate from their austral summer/spring feeding areas in the Bonney Upwelling off Victoria and the Perth Canyon, Western Australia to warmer Indonesian waters for the austral autumn/winter. Blue whales make very low frequency calls ranging between 20-70 Hertz (Hz). These rumbles are so low, that without speeding up the sound, they are, in fact, not audible to humans. However, with custom software, we can see the sound and these rumbles appear as big green lines on our computer screen!

Distinctively, the green vertical lines are a pygmy blue whale call, in the low frequency range of 20-70Hz. Underwater sounds collected by the hydrophones in the sonobuoys which are then computer-processed, allow us to see the sound on board RV Investigator, while the whale is calling. This is live from the Indian Ocean! Photo: Micheline Jenner AM.

Pygmy blue whales depend on krill for their very survival and lots of it–they consume up to 2 tonnes of krill per day! On their migration north the whales are actively stopping to feed. During the day when the ship is stationary and all the scientists are collecting various water and biological samples at the twenty stations on the 110° East meridian, we have been monitoring the sonobuoys. We have plotted the direction of the migration of pygmy blue whales hoping to photograph some of them migrating and feeding. However, maybe those scientists studying zooplankton on board RV Investigator are hoping that we are not joined by a pygmy blue whale as, there could go, all their samples, down the greedy gullet of a 22m long pygmy blue whale!

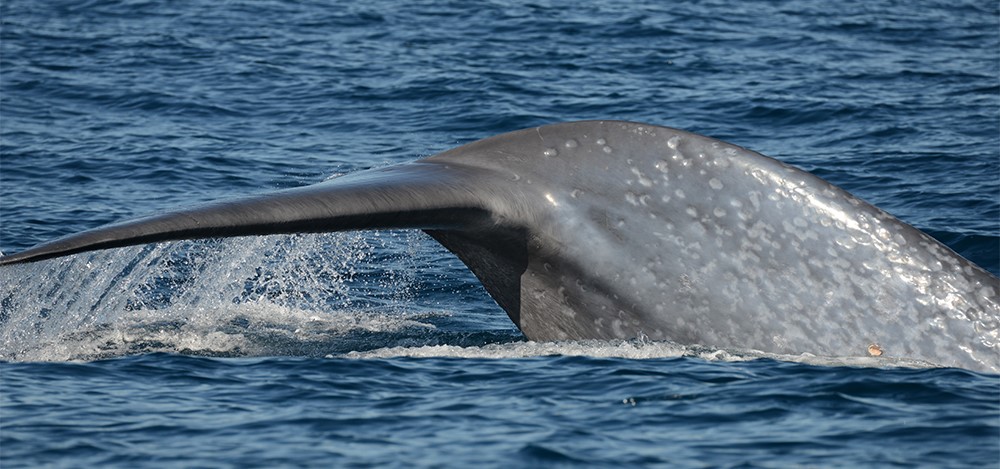
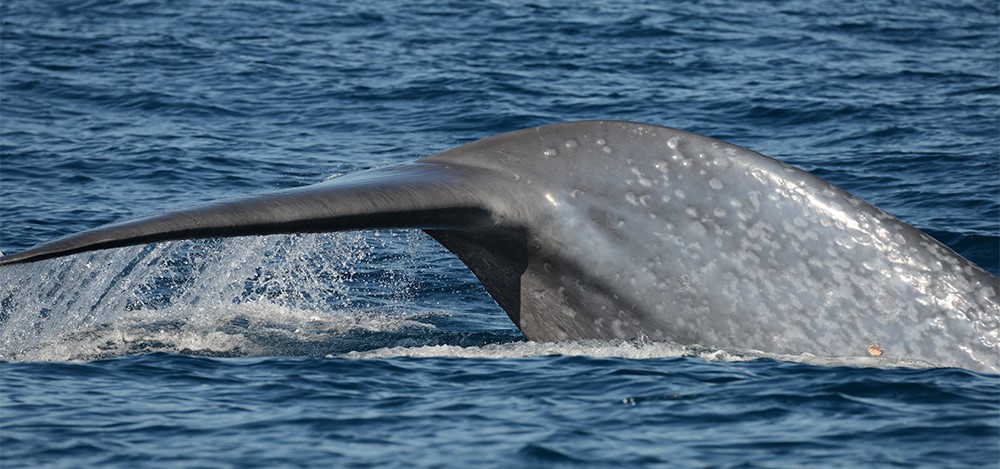
The tell tale shorter and stockier caudal peduncle (from the tail flukes to the dorsal fin) of the so-called pygmy blue whale, as compared with the longer caudal peduncle of the Antarctic blue whale, is shown as this pygmy blue whale raises it’s 7m across flukes to dive down to 500m in the Perth Canyon. Photo: Micheline Jenner AM.

We can hear the whales calling and their unique feeding calls and we know they are migrating north. Just one glimpse of a pygmy blue whale on this IN2019_V03 voyage and we are sure you will hear our joy from wherever you are! Perhaps, as we travel south past the Ningaloo region we might just see one! Hearing is awesome, but seeing them is pretty good too–here’s to hoping!

Be sure to follow the daily posts of our Log from One Ten East at https://iioe-2.incois.gov.in

Blue on Blue – One Ten East log

One Ten East Logs from the IIOE-2 voyage aboard RV Investigator will be posted on the WAMSI website during the month long voyage.


We have had more beautiful deep blue water and amazing cumulus clouds today. The clouds literally forming vertically before our eyes, just gorgeous!

– Captain Micheline Jenner 


Log from One Ten East


The RV Investigator is currently undertaking oceanographic research along the 110°E meridian off Western Australia as part of the second International Indian Ocean Expedition. The voyage is led by Professor Lynnath Beckley of Murdoch University and the research is supported by a grant of sea time on RV Investigator from the CSIRO Marine National Facility.


Date: June 04, 2019

Time:  1200 AWST

Latitude: 12.5°S

Longitude: 110°E

Wind direction: E     

Wind speed: 12 knots

Swell direction: SE 2m

Depth: 4738 m

Air temperature: 27°C

Sea temperature: 28°C

Notes: We have seen a white-tailed tropicbird, a frigate and two golden bosun birds! We are really in the tropics!


Blue on Blue

By Micheline Jenner AM and Curt Jenner AM

Despite their huge size, blue whales are remarkably elusive. Criss-crossing the world’s oceans as part of their life cycle, these days, they are hard to find. Being so large–in fact, the largest animals on earth, blue whales were once the most desired target species for 19th and 20th century whalers. The effort outlaid to chase and capture a whale, known as the catch-per-unit effort was categorized by the whalers as a “1” for a blue whale. The smaller humpback whale was classed as a “4”, indicating that it took four humpback whales to provide the same amount of oil as one prized blue. Alarmingly, in their efforts to provide for lighting of motherland lamps, produce lipstick, wear fine corsets, consume margarine and shade with umbrellas, whalers killed 202,000 to 311,000 Antarctic blue whales and 13,000 pygmy blue whales.

The first blow as a pygmy blue whale surfaces can be up to 9m high. Subsequent exhalations throughout a surfacing sequence, sometimes diffuse in light winds causing a “rainblow” effect. Photo: Micheline Jenner AM.


Now in the 21st century, cetacean scientists are still trying to determine how many blue whales are left in the world’s oceans. The IUCN recognises a global estimate of between 10-25,000 blue whales. Just what proportion of that estimate consists of Antarctic blue whales or pygmy blue whales, is anyone’s guess.
 
By listening to the sea with sonobuoys from RV Investigator, we are documenting the migration of pygmy blue whales while they migrate from their austral summer/spring feeding areas in the Bonney Upwelling off Victoria and the Perth Canyon, Western Australia to warmer Indonesian waters for the austral autumn/winter. Blue whales make very low frequency calls ranging between 20-70 Hertz (Hz). These rumbles are so low, that without speeding up the sound, they are, in fact, not audible to humans. However, with custom software, we can see the sound and these rumbles appear as big green lines on our computer screen!
 

Distinctively, the green vertical lines are a pygmy blue whale call, in the low frequency range of 20-70Hz. Underwater sounds collected by the hydrophones in the sonobuoys which are then computer-processed, allow us to see the sound on board RV Investigator, while the whale is calling. This is live from the Indian Ocean! Photo: Micheline Jenner AM.


Pygmy blue whales depend on krill for their very survival and lots of it–they consume up to 2 tonnes of krill per day! On their migration north the whales are actively stopping to feed. During the day when the ship is stationary and all the scientists are collecting various water and biological samples at the twenty stations on the 110° East meridian, we have been monitoring the sonobuoys. We have plotted the direction of the migration of pygmy blue whales hoping to photograph some of them migrating and feeding. However, maybe those scientists studying zooplankton on board RV Investigator are hoping that we are not joined by a pygmy blue whale as, there could go, all their samples, down the greedy gullet of a 22m long pygmy blue whale!


The tell tale shorter and stockier caudal peduncle (from the tail flukes to the dorsal fin) of the so-called pygmy blue whale, as compared with the longer caudal peduncle of the Antarctic blue whale, is shown as this pygmy blue whale raises it’s 7m across flukes to dive down to 500m in the Perth Canyon. Photo: Micheline Jenner AM.


We can hear the whales calling and their unique feeding calls and we know they are migrating north. Just one glimpse of a pygmy blue whale on this IN2019_V03 voyage and we are sure you will hear our joy from wherever you are! Perhaps, as we travel south past the Ningaloo region we might just see one! Hearing is awesome, but seeing them is pretty good too–here’s to hoping!
 
Be sure to follow the daily posts of our Log from One Ten East at https://iioe-2.incois.gov.in and www.wamsi.org.au


Primary Production – One Ten East Log

One Ten East Logs from the IIOE-2 voyage aboard RV Investigator will be posted on the WAMSI website during the month long voyage.


The sun is shining, the nets are being pulled in and out and life is good aboard RV Investigator. – Captain Micheline Jenner 


Log from One Ten East


The RV Investigator is currently undertaking oceanographic research along the 110°E meridian off Western Australia as part of the second International Indian Ocean Expedition. The voyage is led by Professor Lynnath Beckley of Murdoch University and the research is supported by a grant of sea time on RV Investigator from the CSIRO Marine National Facility.


Date: June 01, 2019 Time:  1200 AWST
Latitude: 17°S Longitude: 110°E
Wind direction: ESE Wind speed: 25 knots
Swell direction: SE 2 m Depth: 5634 m
Air temperature: 27°C Sea temperature: 27°C
Notes: Cooling breezy trade winds and white caps on the ocean today!


Primary Production

By David Antoine

Every year in the contemporary ocean, phytoplankton use energy from the sun to take up carbon, nutrients and trace elements, and to transform it into a staggering amount of about 50 billion tons of organic matter. This is referred to as the oceanic net primary production (NPP), and is equivalent to the annual production of terrestrial plant ecosystems. NPP is commonly expressed in grams of carbon fixed per unit time and ocean surface area, e.g., a daily production in grams of Carbon per square metre. Oceanic NPP is thus a major component of the global carbon cycle, because part of the carbon taken up by phytoplankton is balanced by a flux of carbon dioxide (CO2) from the atmosphere to the ocean. This, combined with the transfer of organic matter (carbon) towards the deep ocean, make up what is referred to as the oceanic biological pump of carbon.


Dr Charlotte Robinson (Curtin University) uses an AC-S spectrophotometer to determine primary production in the continuous flow-through seawater from a sub-surface intake on the RV Investigator. Photo: Micheline Jenner AM.


On the RV Investigator voyage primary production of phytoplankton from different depths of the ocean is being measured using incubations with radioactive Carbon14 in a photosynthetron. These estimates of primary production will be compared with those determined during the first International Indian Ocean Expedition 60 years ago.


Dr Charlotte Robinson (Curtin University) in the modular Isotope Container aboard the RV Investigator, conducting primary production studies with the photosynthetron at different light levels. Photo: Micheline Jenner AM.


Be sure to follow the daily posts of our One Ten East Logs from the IN2019_V03 aboard RV Investigator at https://iioe-2.incois.gov.in and www.wamsi.org.au.

Ocean Food Webs – One Ten East log

One Ten East Logs from the IIOE-2 voyage aboard RV Investigator will be posted on the WAMSI website during the month long voyage.


Today’s rousing trade winds were for perfect sailing across the Indian Ocean pond! If we hang up all the sheets, we’ll be there shortly Kiran and Satya!

What day of the week is it? Ocean life blurs this… every day is blue!

– Captain Micheline Jenner 


Log from One Ten East

The RV Investigator is currently undertaking oceanographic research along the 110°E meridian off Western Australia as part of the second International Indian Ocean Expedition. The voyage is led by Professor Lynnath Beckley of Murdoch University and the research is supported by a grant of sea time on RV Investigator from the CSIRO Marine National Facility.


Date: June 02, 2019 Time:  1200 AWST
Latitude: 15.5°S Longitude: 110°E
Wind direction: E Wind speed: 17 knots
Swell direction: SE 2m, NE 0.5m, SW 2m Depth: 5727 m
Air temperature: 27°C Sea temperature: 27°C
Notes: At Station 17 of 20 on the 110°East line, we are in some of the deepest water so far.


Ocean Food Webs

By Prof Michael Landry


Food webs describe the feeding (trophic) relationships that exist among organisms in an ecosystem. If you have heard the old fisherman’s adage that “big bait catches big fish”, you may intuitively understand how ocean food webs operate, mainly on the basis of size, with larger consumers eating successively smaller prey down to where it all begins with microscopic phytoplankton. This is fundamentally different than food webs on land, where the plants are often much larger than their consumers (e.g., insects grazing on trees).

A further twist of ocean food webs is that different ocean conditions select for different sizes of phytoplankton. In the poorest (oligotrophic) environments, which occur over much of the tropical and subtropical open ocean, very small phytoplankton (photosynthetic bacteria) dominate because they are the most efficient competitors for nutrient uptake at low concentrations. In nutrient-rich coastal systems, large phytoplankton are dominant. One consequence of this difference is that open-ocean food webs lose most of their energy in transfers from tiny producers to tiny consumers on up, with little remaining in the end to support fisheries. In contrast, richer systems with large phytoplankton and larger consumers have fewer steps of intermediate consumers and can channel productivity more efficiently to fishes.

In this project (IN2019_V03), we are taking two approaches to compare food-web relationships along the stations and regions on the cruise track. One is experimental, involving measurements of community composition, productivity and grazing rates. The other utilizes information that resides in the isotopic composition of planktonic consumers to quantify their mean trophic positions in the food web relative to phytoplankton.


Claire Davies (IMOS/CSIRO) halves one of the filtered zooplankton samples for sonification and fluorometric analysis to ascertain grazing by copepods. Photo: Micheline Jenner AM.


Prof Raleigh Hood (University of Maryland Center for Environmental Science) shows the copepod material which was macerated with the sonicator (a low frequency sound emitted from the metal spike, in backgorund) prior to determination of the chlorophyll content. Photo: Micheline Jenner AM.


Claire Davies (IMOS/CSIRO) measures the chlorophyll content with the fluorometer to determine the extent of grazing on phytoplankton by copepods in the mesozooplankton samples collected with the oblique plankton tow. Photo: Micheline Jenner AM.


Be sure to follow our daily Log from One Ten East at https://iioe-2.incois.gov.in or www.wamsi.org.au
 

Isotopes in Food Web Studies – One Ten East Log

One Ten East Logs from the IIOE-2 voyage aboard RV Investigator will be posted on the WAMSI website during the month long voyage.


Today we are at Station 17. We are slowly creeping north with our studies and the pygmy blue whales are calling us northward too! – Captain Micheline Jenner 


Log from One Ten East

The RV Investigator is currently undertaking oceanographic research along the 110°E meridian off Western Australia as part of the second International Indian Ocean Expedition. The voyage is led by Professor Lynnath Beckley of Murdoch University and the research is supported by a grant of sea time on RV Investigator from the CSIRO Marine National Facility.


Date: June 03, 2019 Time:  1200 AWST
Latitude: 14°S Longitude: 110°E
Wind direction: ESE Wind speed: 17 knots
Swell direction: ENE 2m, ESE 2m Depth: 5715 m
Air temperature: 27°C Sea temperature: 28°C
Notes: Two crested terns flew around the ship today. With few seabird sightings in the last week, their fluttering was encouraging and welcome!


Isotopes in Food Web Studies

By Michael Landry

Direct measurements of phytoplankton growth and grazing by micro- and mesozooplankton are one way to look at variability in trophic structure in our study region (e.g., how many steps are mesozooplankton removed on average from phytoplankton). Analyses of bulk nitrogen and carbon isotopes from the size-fractioned mesozooplankton net tows will also provide an independent check on these estimates. Trophic information from isotopes comes from the fact that the lighter and more abundant isotope of nitrogen (14N) is selectively utilized by organisms when they metabolize, so the remaining proteins in animal tissues get enriched in the heavier isotope 15N. There’s a saying for this, “You are what you eat plus 3.4 parts per thousand 15N”, which captures the notion that this particular relationship has been widely applied in food web studies of both aquatic and land systems.

An additional important goal of our study is to use isotopes to determine how the food web may have changed over the five decades since the first International Indian Ocean Expedition (IIOE). This cannot be done by standard bulk isotope method which would require separate sampling for phytoplankton isotopes which vary substantially depending on whether the main source of N to the food web is nitrate mixed upward from deep water or fixed N2 gas from the atmosphere (or some combination). Instead, we will use a relatively new technique called Compound-Specific Isotopic Composition of Amino Acids (CSIA-AA), which relies on differences in isotopic enrichment of individual amino acids to provide information. A group of source AAs retains 15N enrichment values similar to the baseline value of N. Another group of trophic AAs enriches very strongly with each trophic transfer step. The fact that N isotopic composition doesn’t change much with long-term preservation in formalin means we can use historical IIOE samples collected at the same stations and same time of year in the 1960s to compare N sources and trophic structure for the same dominant species sorted from the samples.

Prof Michael Landry (Scripps Institution of Oceanography, USA) filters the size-fractionated mesozooplankton collected in the oblique plankton net tow. Photo: Micheline Jenner AM.


The size-fractionated mesozooplankton are filtered onto glass filter paper for further processing to assess isotopes. Photo: Micheline Jenner AM.


Prof. Lynnath Beckley (Chief Scientist, Murdoch University) labels a zooplankton sample for isotope analysis for the study with Prof Michael Landry (Scripps Institution of Oceanography, USA) examining isotopes in oceanic food webs. Photo: Micheline Jenner AM.


Freshly caught Margrethia sp. larval fish with their stomachs full of copepods (shown as red and orange) inside their transparent bodies. It’s not always so easy to see what fish have eaten! Photo: Dr Pilar Olivar (CSIC, Barcelona).


Be sure to follow our daily Log from One Ten East at https://iioe-2.incois.gov.in or www.wamsi.org.au
 

Mysteries of pristine Kimberley wilderness are being unravelled at last

The natural mysteries of the Kimberley, one of Australia’s last pristine habitats, have been documented like never before thanks to a multi-million-dollar project.


Category: 

Kimberley Marine Research Program

Mysteries of pristine Kimberley wilderness are being unravelled at last

The natural mysteries of the Kimberley, one of Australia’s last pristine habitats, have been documented like never before thanks to a multi-million-dollar project.

Full story on ABC News by Matt Bamford

Isotopes in Food Web Studies – One Ten East Log

One Ten East Logs from the IIOE-2 voyage aboard RV Investigator will be posted on the WAMSI website during the month long voyage.

Today we are at Station 17. We are slowly creeping north with our studies and the pygmy blue whales are calling us northward too! – Captain Micheline Jenner 

Log from One Ten East

The RV Investigator is currently undertaking oceanographic research along the 110°E meridian off Western Australia as part of the second International Indian Ocean Expedition. The voyage is led by Professor Lynnath Beckley of Murdoch University and the research is supported by a grant of sea time on RV Investigator from the CSIRO Marine National Facility.

Date: June 03, 2019 Time:  1200 AWST
Latitude: 14°S Longitude: 110°E
Wind direction: ESE Wind speed: 17 knots
Swell direction: ENE 2m, ESE 2m Depth: 5715 m
Air temperature: 27°C Sea temperature: 28°C

Notes: Two crested terns flew around the ship today. With few seabird sightings in the last week, their fluttering was encouraging and welcome!

Isotopes in Food Web Studies

By Michael Landry

Direct measurements of phytoplankton growth and grazing by micro- and mesozooplankton are one way to look at variability in trophic structure in our study region (e.g., how many steps are mesozooplankton removed on average from phytoplankton). Analyses of bulk nitrogen and carbon isotopes from the size-fractioned mesozooplankton net tows will also provide an independent check on these estimates. Trophic information from isotopes comes from the fact that the lighter and more abundant isotope of nitrogen (14N) is selectively utilized by organisms when they metabolize, so the remaining proteins in animal tissues get enriched in the heavier isotope 15N. There’s a saying for this, “You are what you eat plus 3.4 parts per thousand 15N”, which captures the notion that this particular relationship has been widely applied in food web studies of both aquatic and land systems.

An additional important goal of our study is to use isotopes to determine how the food web may have changed over the five decades since the first International Indian Ocean Expedition (IIOE). This cannot be done by standard bulk isotope method which would require separate sampling for phytoplankton isotopes which vary substantially depending on whether the main source of N to the food web is nitrate mixed upward from deep water or fixed N2 gas from the atmosphere (or some combination). Instead, we will use a relatively new technique called Compound-Specific Isotopic Composition of Amino Acids (CSIA-AA), which relies on differences in isotopic enrichment of individual amino acids to provide information. A group of source AAs retains 15N enrichment values similar to the baseline value of N. Another group of trophic AAs enriches very strongly with each trophic transfer step. The fact that N isotopic composition doesn’t change much with long-term preservation in formalin means we can use historical IIOE samples collected at the same stations and same time of year in the 1960s to compare N sources and trophic structure for the same dominant species sorted from the samples.

Prof Michael Landry (Scripps Institution of Oceanography, USA) filters the size-fractionated mesozooplankton collected in the oblique plankton net tow. Photo: Micheline Jenner AM.


The size-fractionated mesozooplankton are filtered onto glass filter paper for further processing to assess isotopes. Photo: Micheline Jenner AM.


Prof. Lynnath Beckley (Chief Scientist, Murdoch University) labels a zooplankton sample for isotope analysis for the study with Prof Michael Landry (Scripps Institution of Oceanography, USA) examining isotopes in oceanic food webs. Photo: Micheline Jenner AM.

3

Freshly caught Margrethia sp. larval fish with their stomachs full of copepods (shown as red and orange) inside their transparent bodies. It’s not always so easy to see what fish have eaten! Photo: Dr Pilar Olivar (CSIC, Barcelona).

Ocean Food Webs – One Ten East log

One Ten East Logs from the IIOE-2 voyage aboard RV Investigator will be posted on the WAMSI website during the month long voyage.

Today’s rousing trade winds were for perfect sailing across the Indian Ocean pond! If we hang up all the sheets, we’ll be there shortly Kiran and Satya!
What day of the week is it? Ocean life blurs this… every day is blue!
– Captain Micheline Jenner 

Log from One Ten East

The RV Investigator is currently undertaking oceanographic research along the 110°E meridian off Western Australia as part of the second International Indian Ocean Expedition. The voyage is led by Professor Lynnath Beckley of Murdoch University and the research is supported by a grant of sea time on RV Investigator from the CSIRO Marine National Facility.

Date: June 02, 2019 Time:  1200 AWST
Latitude: 15.5°S Longitude: 110°E
Wind direction: E Wind speed: 17 knots
Swell direction: SE 2m, NE 0.5m, SW 2m Depth: 5727 m
Air temperature: 27°C Sea temperature: 27°C

Notes: At Station 17 of 20 on the 110°East line, we are in some of the deepest water so far.

Ocean Food Webs

By Prof Michael Landry

Food webs describe the feeding (trophic) relationships that exist among organisms in an ecosystem. If you have heard the old fisherman’s adage that “big bait catches big fish”, you may intuitively understand how ocean food webs operate, mainly on the basis of size, with larger consumers eating successively smaller prey down to where it all begins with microscopic phytoplankton. This is fundamentally different than food webs on land, where the plants are often much larger than their consumers (e.g., insects grazing on trees).

A further twist of ocean food webs is that different ocean conditions select for different sizes of phytoplankton. In the poorest (oligotrophic) environments, which occur over much of the tropical and subtropical open ocean, very small phytoplankton (photosynthetic bacteria) dominate because they are the most efficient competitors for nutrient uptake at low concentrations. In nutrient-rich coastal systems, large phytoplankton are dominant. One consequence of this difference is that open-ocean food webs lose most of their energy in transfers from tiny producers to tiny consumers on up, with little remaining in the end to support fisheries. In contrast, richer systems with large phytoplankton and larger consumers have fewer steps of intermediate consumers and can channel productivity more efficiently to fishes.

In this project (IN2019_V03), we are taking two approaches to compare food-web relationships along the stations and regions on the cruise track. One is experimental, involving measurements of community composition, productivity and grazing rates. The other utilizes information that resides in the isotopic composition of planktonic consumers to quantify their mean trophic positions in the food web relative to phytoplankton.

Claire Davies (IMOS/CSIRO) halves one of the filtered zooplankton samples for sonification and fluorometric analysis to ascertain grazing by copepods. Photo: Micheline Jenner AM.


Prof Raleigh Hood (University of Maryland Center for Environmental Science) shows the copepod material which was macerated with the sonicator (a low frequency sound emitted from the metal spike, in backgorund) prior to determination of the chlorophyll content. Photo: Micheline Jenner AM.


Claire Davies (IMOS/CSIRO) measures the chlorophyll content with the fluorometer to determine the extent of grazing on phytoplankton by copepods in the mesozooplankton samples collected with the oblique plankton tow. Photo: Micheline Jenner AM.